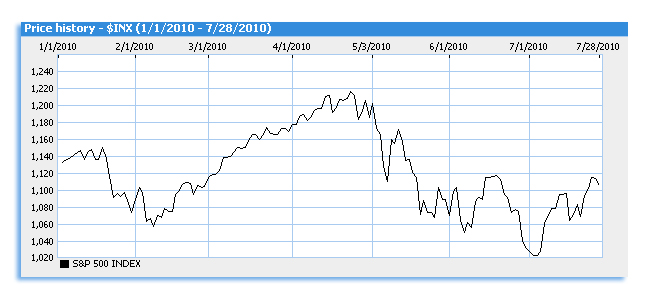
S&P 500 Performance Chart

This week, with the exception of US Steel (NYSE:X) and a few others we have not only seen tremendous earnings come out of the large caps but positive guidance as well. This has led us to become focused on the 1113.00 level with the S&P 500. The market closed above this key number on both Monday and Tuesday, but this widely watched level remains in play.
Tuesday’s action was highlighted by positive earnings from Dupont (NYSE:DD) and Lockheed Martin (NYSE:LMT), but those results only propped up the market slightly. Every rally seemed to be met by profit taking. Commodity stocks were among the weakest. The story may not play out until Friday when the GDP report is released. In the face of these great earnings this rally has seemed to stall out on economic numbers.
The ongoing trend tells us that more positive earnings will be released. But the question is, are the next wave of upside surprises factored in already? Only time will tell. Now how will this market impact the OTCBB ? Common sense says that if Fed Ex (NYSE:FDX) and United Parcel Service (NYSE:UPS) have positive outlooks, we may see a micro cap retailer develop into a hot penny stock. We also could see some bottom fishing in some gold and silver mining penny stocks due to a pullback in metals. The tough part is to decipher which mining names are actual values. We all have seen various penny stock newsletters highlight the next mining home run. So if you act on the commodity pullback be selective and do your homework. We will have more penny stock ideas on the way soon.


